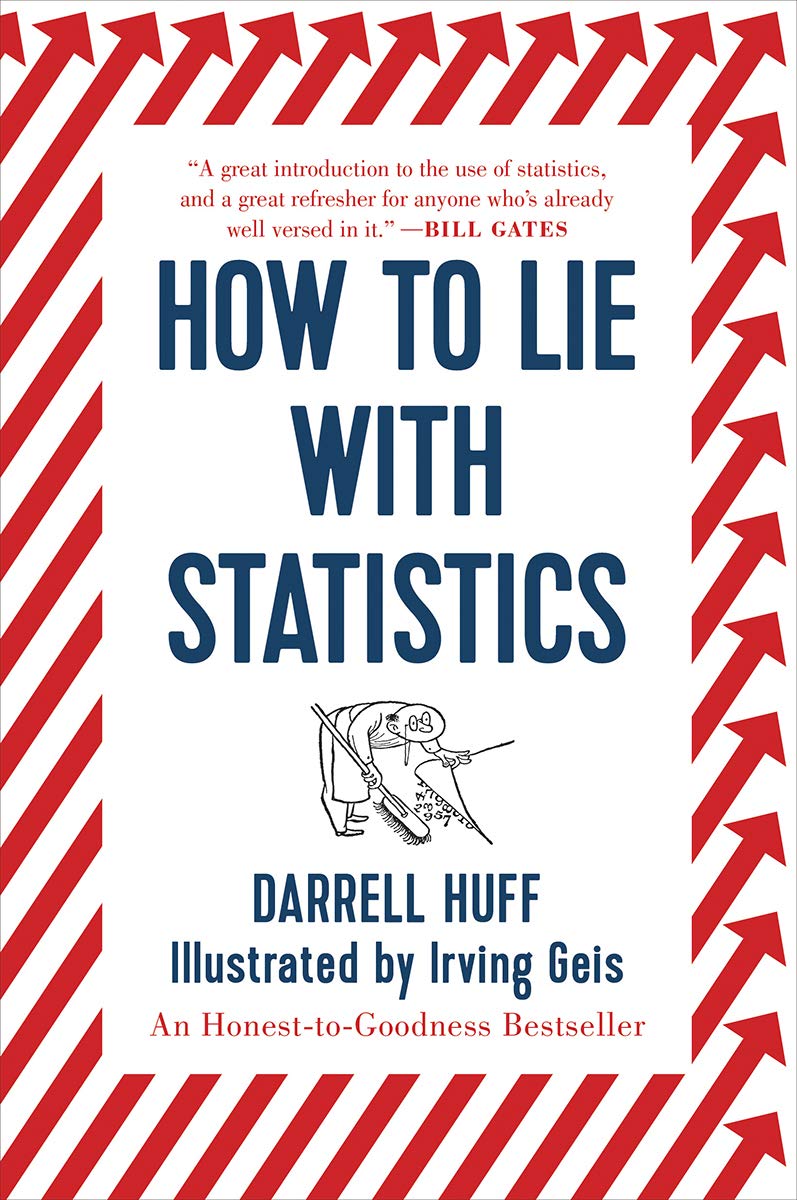
Summary and Review: How to Lie With Statistics
An Honest-to-Goodness Bestseller
✍️ The Author
This book was written by Darrell Huff and published in 1954. Huff is well-known for publishing this best-seller and assisting the tobacco lobby as a statistician.
💡 Thesis of the Book
Statistics is a tool for trickster’s to fool the statistically ignorant. By learning how to swap fact for fiction using quantitative slight-of-hand, you’ll better prepared to catch the swindler’s red-handed.
“The secret language of statistics, so appealing in a fact-minded culture, is employed to sensationalize, inflate, confuse, and oversimplify.”
“This book is a sort of primer in ways to use statistics to deceive… Crooks already know these tricks. Honest men must learn them in self defense.”
💭 My Thoughts
This book is a data literacy classic that has influenced the way many of us interact with number-based claims, especially in the internet era. I know it certainly has given me a healthy dose of skepticism anytime I hear a statistically-backed claim or see a data visualization. In agreement with Tim Harford, I think this book is a bit too cynical. You walk away from it with the sense that statistics are a swindler’s tool, but it is much more than that. Andrejs Dunkels says it best, “It is easy to lie with statistics. It is hard to tell the truth without it.” I prefer Harford’s thesis in The Data Detective, which plants its flag in curiosity rather than cynicism. I do find the ironies surrounding this book rather amusing. After finishing the book, I glance at the backcover and had a good laugh. I saw the NY Times and the Atlantic stamp their approval on the backcover, which is like the captain of the titanic giving the foreword for a book about driving big boats. However, the real irony lies in what Huff did after writing this book. He was hired by the tobacco industry to manufacture doubt about the relationship between smoking and lung cancer through the use of “statisculation” (to borrow Huff’s term). In general, this book has a rich history and the principles one can derive from it are essential for navigating a digital landscape plagued with misleading information. I recommend it to everyone, regardless of statistical background, and in conjunction with Harford’s The Data Detective.
📕 Outline
The chapters are very brief, so I put together an outline for the entire book.
- Samples can have bias built-in, which distorts any conclusions you draw from it (chapter 1)
- The problem with statistical theory is that it’s theory. In practice, random samples rarely exist. They are too costly and infeasible to construct.
- Sampling process is more important than sample size because sampling bias is more dominant than sampling error.
- In 1936, Literary Digest polled its ten million subscribers and concluded the election would be dominated by Republican candidate Landon in a 370-161 victory over Roosevelt, but it swung to Roosevelt. The Literary Digest’s subscriber base was a biased sample that skewed heavy Republican. A massive sample size was not enough to overcome the sampling bias. Moral of the story: sampling process outweighs sample size.
- You can derive completely different impressions about a population just by changing the measure of central tendency reported (chapter 2)
- The mean is subject to the influence of outliers, which can inflate the perception of central tendency in a group.
- You need the “little figures” to derive substantive meaning from studies/analyses (chapter 3)
- The sample size, p-value, and measures of dispersion provide crucial context. Don’t overlook them.
- Don’t let isolated statistical elements influence your thinking. Knowing just enough to be misled is more dangerous than knowing nothing.
- Pay attention to the consistency of measurement, i.e. the standard error (chapter 4)
- For example, an IQ test samples intellect with a certain level of precision. You might draw invalid conclusions from comparisons of individuals that fall within the test’s range of error.
- Visualizations are perfect tools for manipulating the message purveyed from data (chapter 5)
- The journalist special: mapping a one-dimensional comparison into a multidimensional representation (chapter 6)
- Build up a false conclusion by equating non-equivalent phenomenon (chapter 7)
- The classic statistical trick: suggest a causal relationship using correlation (chapter 8)
- When two variables are correlated, always check if both correlate with time. Any variables that change with time will be correlated, but may not be directly related.
- Statisticulation: the use of statistics to manipulate thoughts and emotions (chapter 9)
- Be skeptical of statistics, but don’t disregard them
- The best way to collapse a misleading statistic is to probe it with questions (chapter 10)
- Who says so?
- How does he/she know?
- What’s missing?
- Did somebody change the subject?
- Does it make sense?
